
Spotting market reversals is one of the hardest skills in trading. Prices often fake out, trapping traders on the wrong side of the move. That’s where the Gartley pattern comes in, a nearly century-old formation that still helps traders pinpoint turning points with precision.
First introduced by H.M. Gartley in his 1935 book Profits in the Stock Market, the pattern became one of the earliest examples of harmonic trading. Combining chart structure with Fibonacci ratios provides a systematic way to anticipate reversals rather than relying on intuition.
What Is the Gartley Pattern?
The Gartley is a harmonic chart pattern made up of four price swings, labeled X-A, A-B, B-C, and C-D. When these legs align with key Fibonacci ratios, the pattern signals a high-probability reversal at point D.
• A Bullish Gartley forms after a downtrend, completing near point D and suggesting a reversal to the upside (W-shaped).
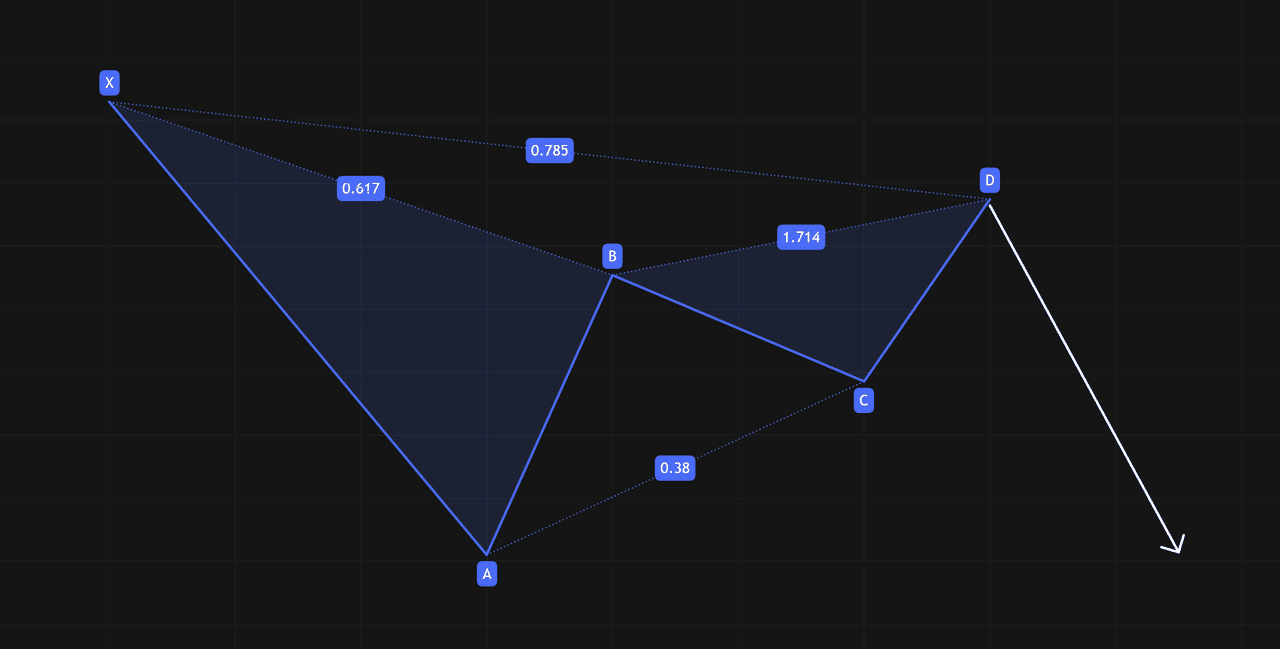
• A Bearish Gartley forms after an uptrend, completing near point D and suggesting a reversal to the downside (M-shaped).
The final C-D leg is where traders focus. If price reacts at point D, it can mark the start of a powerful reversal trade.
History of the Gartley Pattern
H.M. Gartley’s research in the 1930s laid the foundation for modern harmonic patterns. His work moved technical analysis away from guesswork and toward measurable structures. The Gartley pattern became the centerpiece of this approach, offering traders a repeatable framework for spotting price setups that hint at a shift in trend.
What Is the Fundamental Structure of the Gartley Pattern?
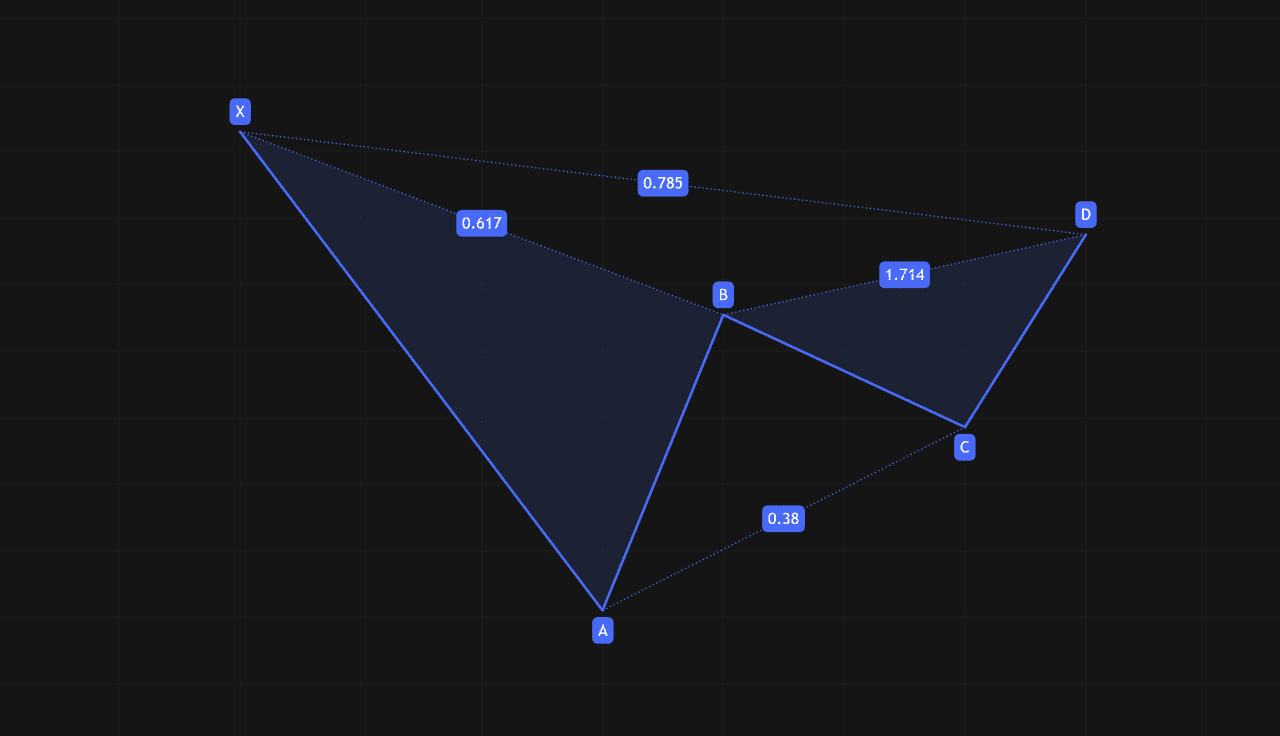
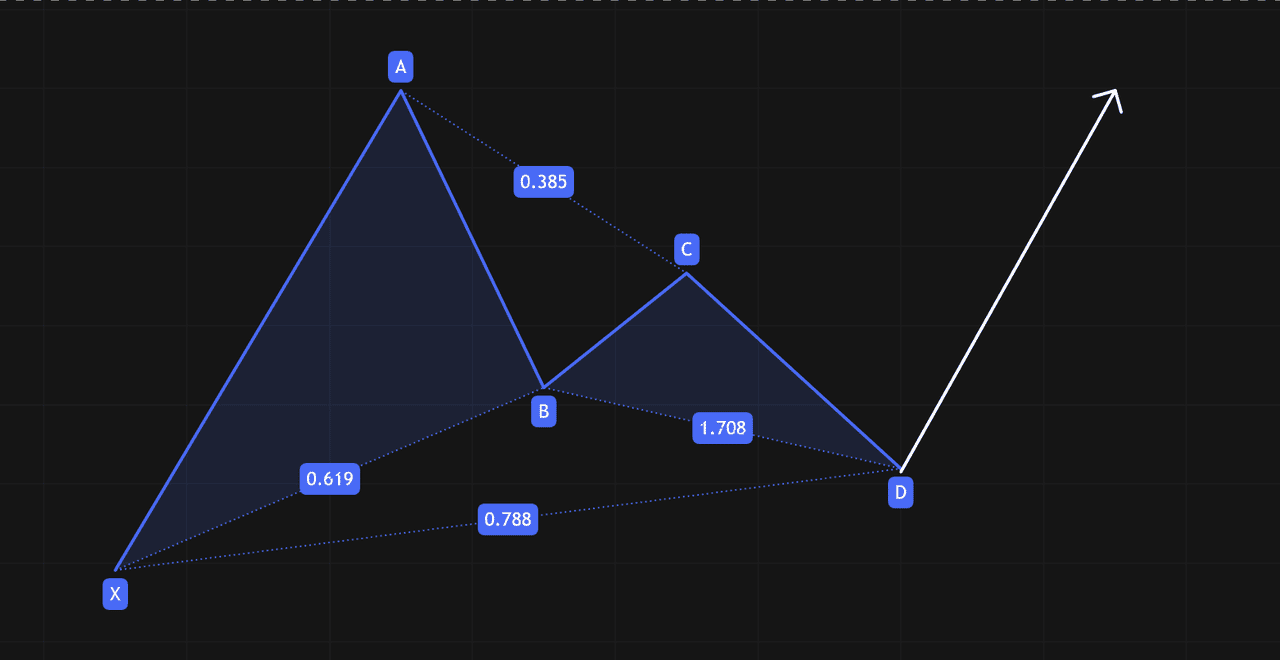
The Gartley is a harmonic pattern built from four connected price swings. Each leg follows a measured move, creating a distinctive shape that traders recognize with the help of Fibonacci ratios.
1. X to A – The first impulse leg, which can be either bullish or bearish.
2. A to B – A retracement of the X-A move, usually pulling back around 61.8%.
3. B to C – A secondary move in the direction of the original impulse, retracing between 38.2% and 88.6% of A-B.
4. C to D – The final leg, ideally completing near the 78.6% retracement of the X-A move. Point D is where traders look for reversals.
Source: BTC/USDT Trading Chart on BingX
When complete, the pattern outlines an “M” shape for bearish Gartleys or a “W” shape for bullish Gartleys. Point D becomes the decision zone, where traders prepare for entries with stops beyond point X.
Key Characteristics of the Gartley Pattern
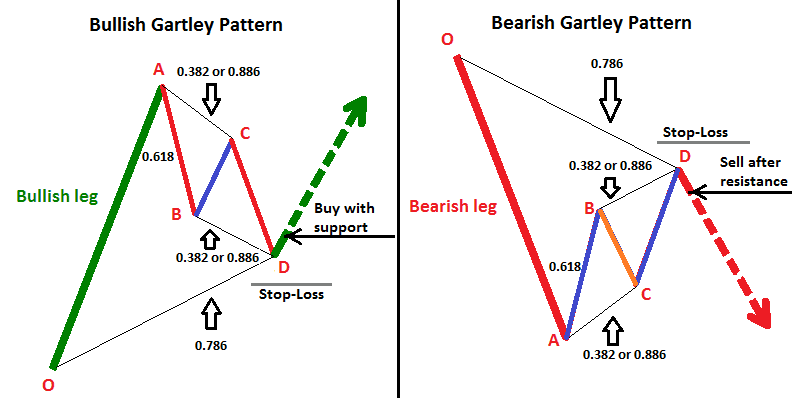
Recognizing the Gartley pattern entails identifying specific Fibonacci ratios between the legs of the pattern. The two primary Gartley patterns, the "Bearish Gartley" and the "Bullish Gartley," each possess their unique Fibonacci relationships:
Bearish Gartley Pattern:
• A to B leg retraces 61.8% of the X to A leg.
• C to D leg terminates at the 78.6% Fibonacci extension level of the X to A leg.
Source: BTC/USDT Trading Chart on BingX
Bullish Gartley Pattern:
• A to B leg retraces 61.8% of the X to A leg.
• C to D leg terminates at the 78.6% Fibonacci extension level of the X to A leg.
Source: BTC/USDT Trading Chart on BingX
How to Apply the Gartley Pattern in Crypto Trading
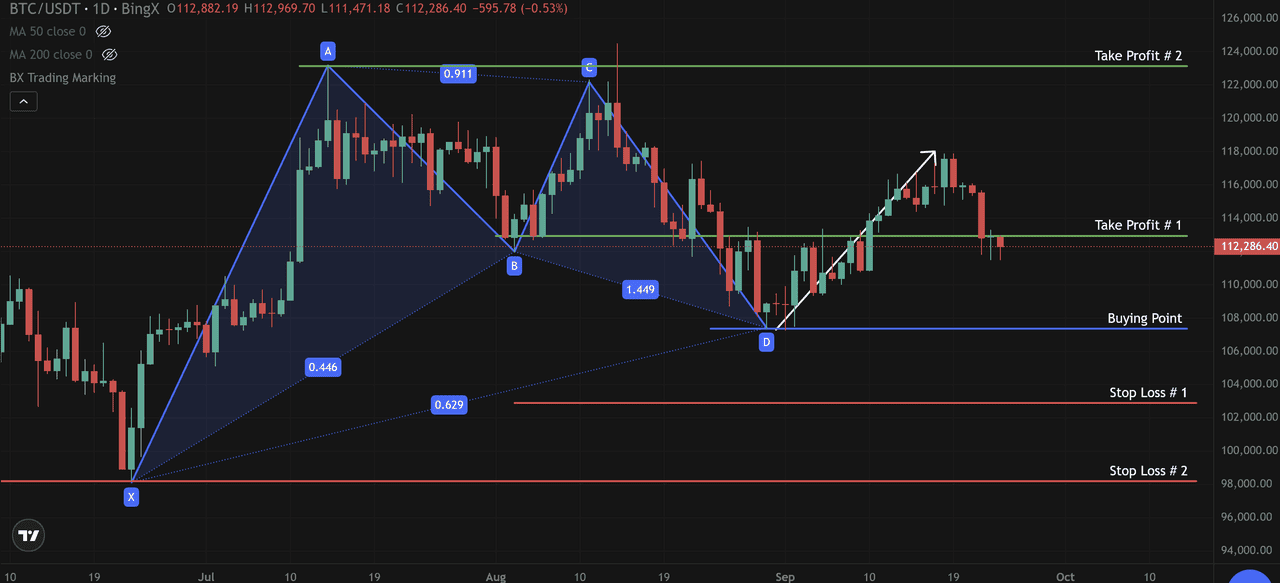
The Gartley pattern is a roadmap that helps traders anticipate reversals with defined risk. In the BTC/USDT daily chart above, a bullish Gartley setup emerged, giving traders a structured trade plan instead of guesswork. Price initially rallied from point X near $97,000 to point A at $124,000 before correcting down to $108,000 at point B.
Source: BTC/USDT Trading Chart on BingX
After a rebound toward $118,000 at point C, Bitcoin retraced again and completed the Gartley near $108,000 at point D. This completion point gave traders the opportunity to prepare for a bullish reversal.
How to Combine Gartley Pattern with Other Technical Indicators
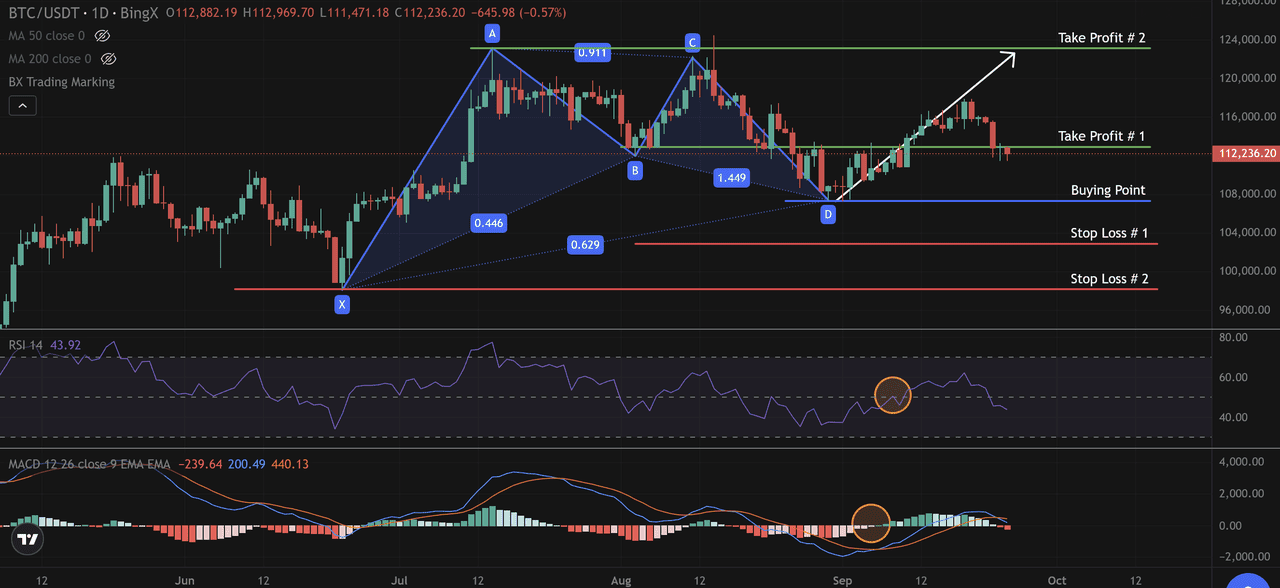
The confirmation didn’t come from price alone. Both the Relative Strength Index (RSI) and the Moving Average Convergence Divergence (MACD) strengthened the setup. The Relative Strength Index bounced from oversold levels near 40 and crossed above 50 as the price turned from point D, signaling renewed buying pressure.
At the same time, the Moving Average Convergence Divergence (MACD) printed a bullish crossover, with histogram bars flipping green. This reinforced the bullish bias and gave traders added conviction that point D was a reliable entry zone.
Source: BTC/USDT Trading Chart on BingX
At the same time, MACD printed a bullish crossover, with histogram bars flipping green, reinforcing the bullish bias. Together, these signals gave traders confidence that point D was a reliable entry zone.
From there, a buying strategy could be built around the following framework:
• Entry: Near $108,000 when price showed bullish confirmation.
• Stop-loss: Conservative traders placed it just below $104,000, while longer-term holders could set it below point X at $97,000.
• Take-profit: The first target aligned with point B around $114,000, while the second target pointed back toward point A at $124,000.
This created a favorable risk-to-reward ratio. Buying at $108,000 with a stop at $104,000 risked $4,000 per BTC, while the potential gain to $124,000 offered a $16,000 upside, a 4:1 ratio. Traders with tighter stops could aim for 2:1 or higher.
By combining the Gartley structure with RSI and MACD confirmation, traders avoided premature entries and gained a well-defined strategy. The beauty of this approach is that it outlines exactly where to buy, where to cut losses, and where to take profits, turning a complex harmonic pattern into a practical, tradable setup.
Limitations of the Gartley Pattern
The Gartley pattern offers precision through structure and Fibonacci ratios, but traders should remain aware of its drawbacks. Here are some of the key limitations.
1. Subjectivity in Pattern Identification: Identifying Gartley patterns often involves discretion. Two traders may draw the same price action differently, leading to inconsistent setups and potential false signals.
2. Reliance on Specific Fibonacci Ratios: The Gartley pattern relies heavily on specific Fibonacci ratios for validation. While these ratios can provide strong confirmation when present, they are not always precise. Market conditions and price movements can deviate from the ideal Fibonacci levels, leading to pattern failures or false signals.
3. Rare Occurrence: Gartley patterns are relatively rare compared to other chart patterns, such as triangles or head and shoulders formations. Traders may find it challenging to spot Gartley patterns regularly, limiting their applicability in fast-moving markets or lower timeframes.
4. Vulnerability to Market Volatility: Like many technical patterns, Gartley patterns are not immune to market volatility. Rapid price fluctuations and unexpected news events can disrupt the pattern's development, rendering it less reliable.
5. Risk-Reward Considerations: While Gartley patterns can provide clear entry and stop-loss levels, traders must carefully consider their risk-reward ratios. In some cases, the potential reward may not justify the risk taken, making it essential to assess the overall risk associated with each trade.
6. Confirmation Required: Successful trading with Gartley patterns often requires additional confirmation from other technical indicators or price action signals. Relying solely on the pattern without complementary analysis may result in missed opportunities or false signals.
7. Overemphasis on Historical Data: Gartley patterns are primarily based on historical price data. They may not fully account for evolving market conditions, news events, or fundamental factors that can impact price movements. Traders should integrate fundamental analysis and stay updated on relevant news to make well-rounded trading decisions.
8. Continuous Learning and Adaptation: To effectively use Gartley patterns, traders must commit to continuous learning and adaptation. Markets evolve, and what worked in the past may not always work in the future. Staying informed about emerging trading strategies and market dynamics is crucial for long-term success.
Conclusion
The Gartley pattern, introduced in 1935 by H.M. Gartley, remains one of the most recognized harmonic setups. It helps traders spot reversal zones with Fibonacci precision and provides clear entry, stop-loss, and take-profit levels.
A bullish Gartley points to an upside reversal after a downtrend, while a bearish Gartley warns of a correction after an uptrend. Though reliable, it works best when confirmed with indicators like the Relative Strength Index (RSI), the Moving Average Convergence Divergence (MACD), or volume.
When used with discipline and risk management, the Gartley pattern shifts from theory to a practical framework for trading crypto’s volatile markets.
Related Reading
FAQs on Gartley Pattern
1. What is the Gartley pattern in crypto trading?
The Gartley is a harmonic chart pattern that uses Fibonacci ratios across four legs (X-A, A-B, B-C, C-D) to identify potential reversal zones at point D.
2. How do you trade the Gartley pattern?
Traders enter near point D when price confirms reversal, place a stop-loss beyond point X, and target points B and A for take-profit.
3. Is the Gartley pattern bullish or bearish?
It can be both. A bullish Gartley signals a reversal higher after a downtrend, while a bearish Gartley points to a reversal lower after an uptrend.
4. How reliable is the Gartley pattern in crypto markets?
It can be effective when confirmed with tools like the Relative Strength Index (RSI), the Moving Average Convergence Divergence (MACD), or volume. However, it is relatively rare and sometimes subjective to identify.
5. What are the risks of trading the Gartley pattern?
The main risks include false signals from misidentification, deviation from ideal Fibonacci ratios, and volatility-driven invalidations. Traders should always use stop-losses and confirm with other indicators.
