
Spotting reversals early can save profits and improve entries. Triple tops and triple bottoms are rare, high-signal patterns that mark the point where buyers or sellers finally lose control. When confirmed, they help traders with timing exits, entries, and risk management.
These setups work on any timeframe. Higher timeframes usually carry more weight, but intraday traders can still use the same rules with strict risk management.
What Is a Triple Bottom Pattern?
A triple bottom is a bullish reversal pattern that forms after a downtrend. Price tests the same support area three times and fails to break lower. The range tightens, sellers tire, and a breakout above the neckline signals trend change.
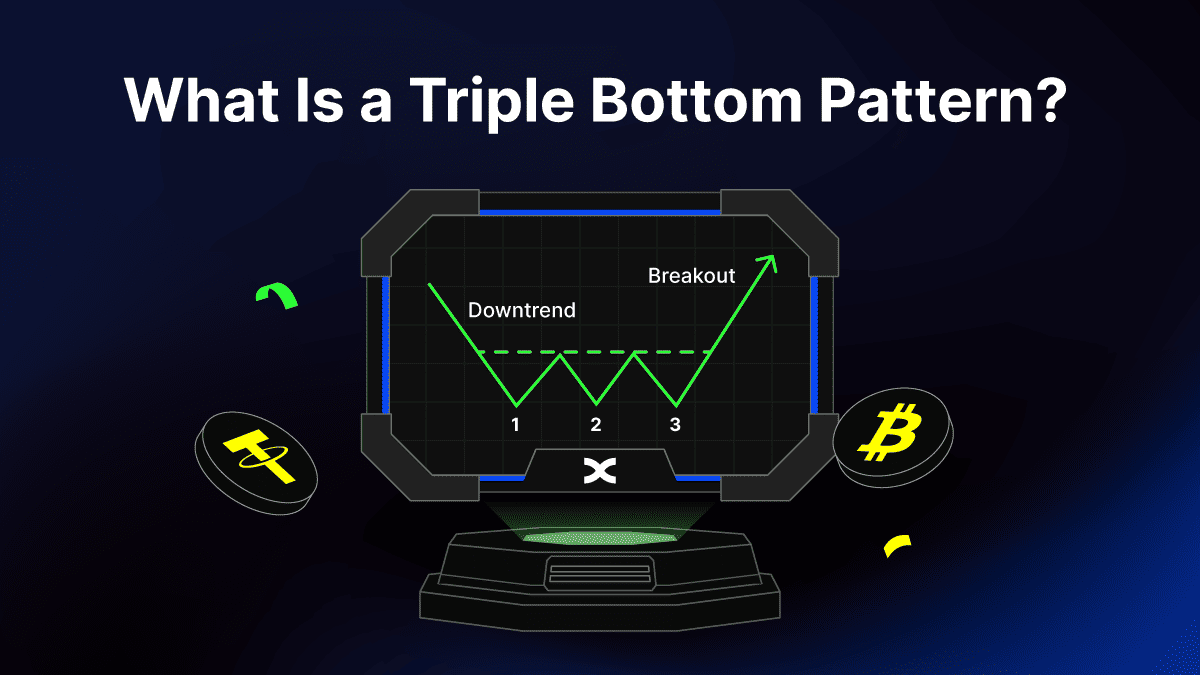
Think of a W shape with three similar lows and a horizontal or near-horizontal neckline. The pattern is only valid after a decline. The breakout becomes more reliable when it closes above the neckline with rising volume or wider bullish candles.
Confirmation checklist
• Three lows at a similar level after a prior downtrend
• A clear neckline formed by highs between the lows
• A confirmed close above the neckline for entry
What to Expect After a Triple Bottom
Many traders place entries on the confirmed break or on a retest of the neckline. Stops often sit below the lowest low. A common first target equals the height of the pattern projected above the neckline. Volume expansion adds confidence but is not mandatory.
What Is a Triple Top Pattern?
A triple top is the bearish counterpart of the triple bottom. It appears after an uptrend when price tests the same resistance three times and fails to break higher. This signals that buyers are losing strength while sellers gain control.
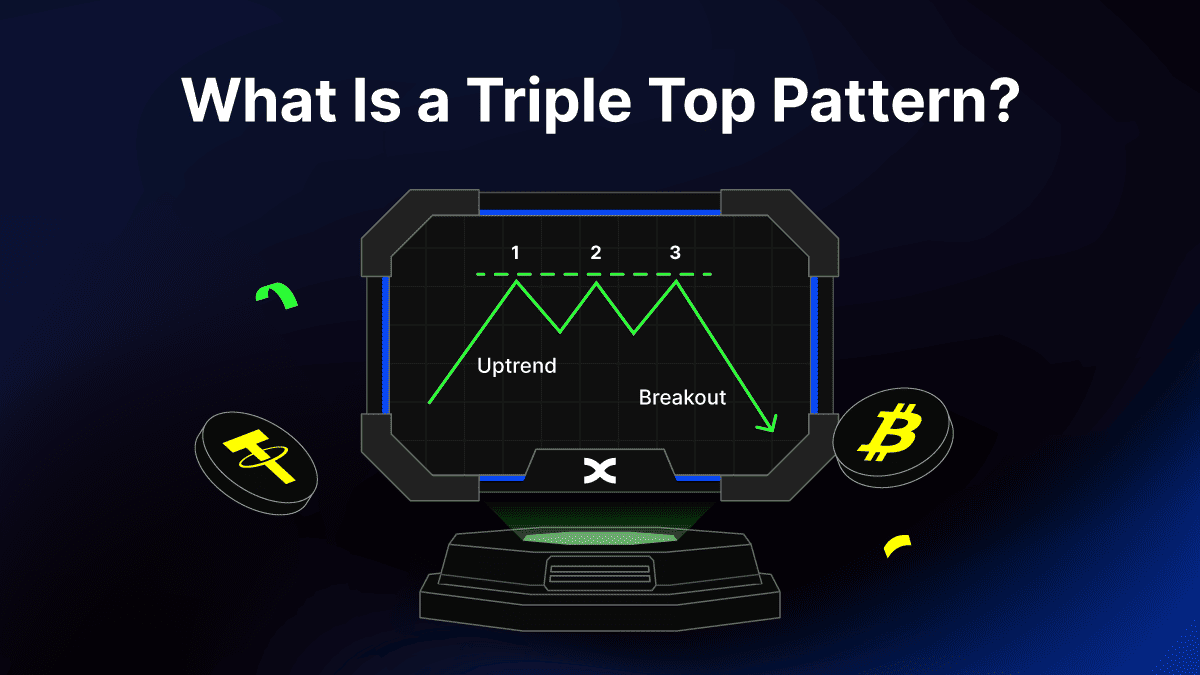
The shape looks like an M with three similar peaks and a horizontal neckline. The neckline is drawn across the lowest points between the peaks. Once price closes below this neckline, the bearish reversal is confirmed.
Confirmation checklist
• Three peaks near the same price level after a prior uptrend
• A neckline formed by two swing lows between the peaks
• A breakdown and close below the neckline confirms the pattern
What to Expect After a Triple Top
Traders often enter short positions on the confirmed break or after a retest of the neckline as resistance. A stop-loss is typically placed just above the highest peak. The first target is measured by subtracting the height of the pattern from the neckline. Stronger signals come with higher volume on the breakdown.
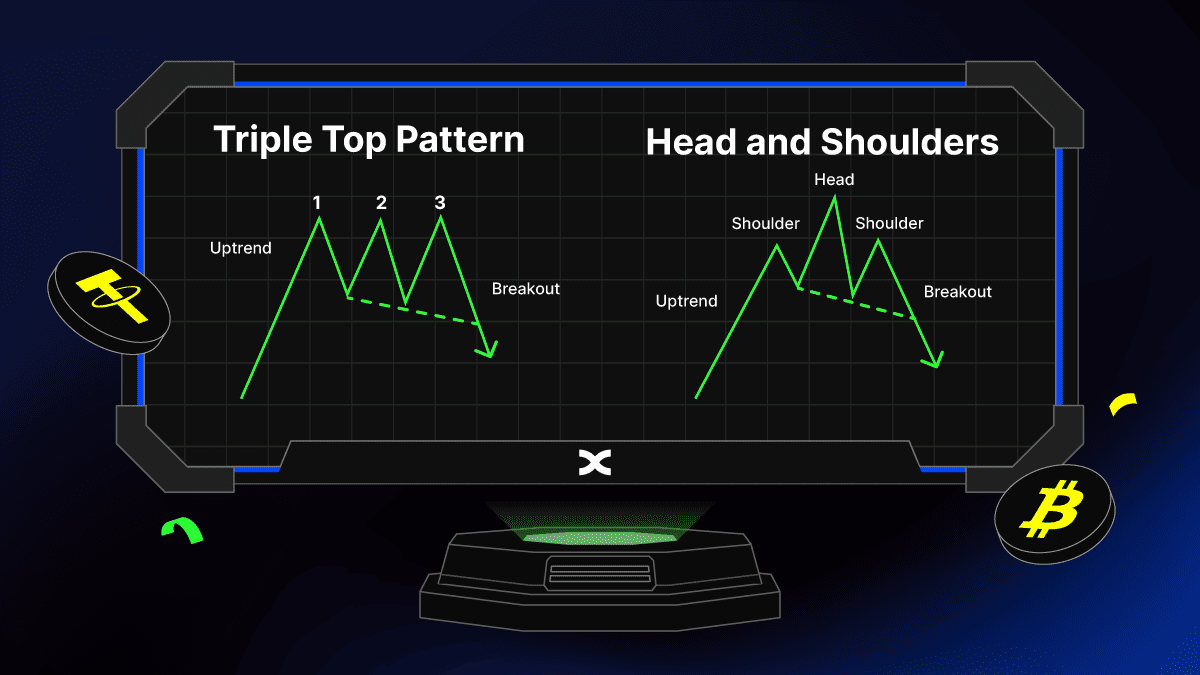
Triple Top Pattern vs. Head and Shoulders: Key Differences
The triple top can resemble the head and shoulders pattern, but there’s a key difference. In a triple top, the three peaks sit near the same level. On the head and shoulders, the middle peak rises higher than the ones on either side.
Despite the visual difference, both patterns indicate the same outcome: a loss of bullish strength, followed by a break below support and the initiation of a new downtrend.
• For bullish traders, the triple top serves as a warning sign. It’s often the cue to tighten stop-loss levels, reduce exposure, or lock in profits before a correction deepens.
• For bearish traders, confirmation of the breakdown is an opportunity to enter short positions. Stops are usually placed just above the highs, while profit targets are set by measuring the height of the pattern.
This makes the triple top one of the most practical tools for spotting reversals early and preparing for downside moves.
How to Identify Triple Top and Bottom Patterns
Triple tops and bottoms are reversal patterns that only matter in the right context. A triple top forms after an uptrend when price fails three times to break resistance. A triple bottom forms after a downtrend when price fails three times to break support. Without a clear prior trend, the setup has little value.
Key visual traits
• Triple top: three highs at a similar level, neckline drawn across the swing lows
• Triple bottom: three lows at a similar level, neckline drawn across the swing highs
• Confirmation: a close beyond the neckline, ideally with volume expansion
If the three highs or lows differ too much in price, the setup is invalid and may represent a different pattern, such as a head and shoulders or a rectangle range.
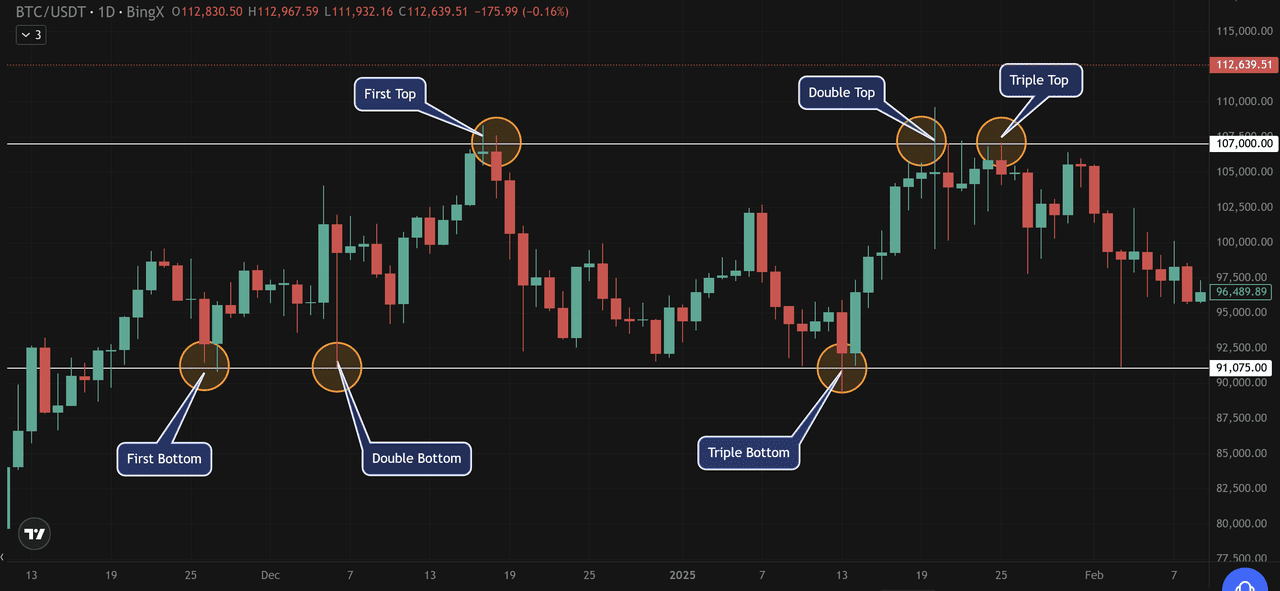
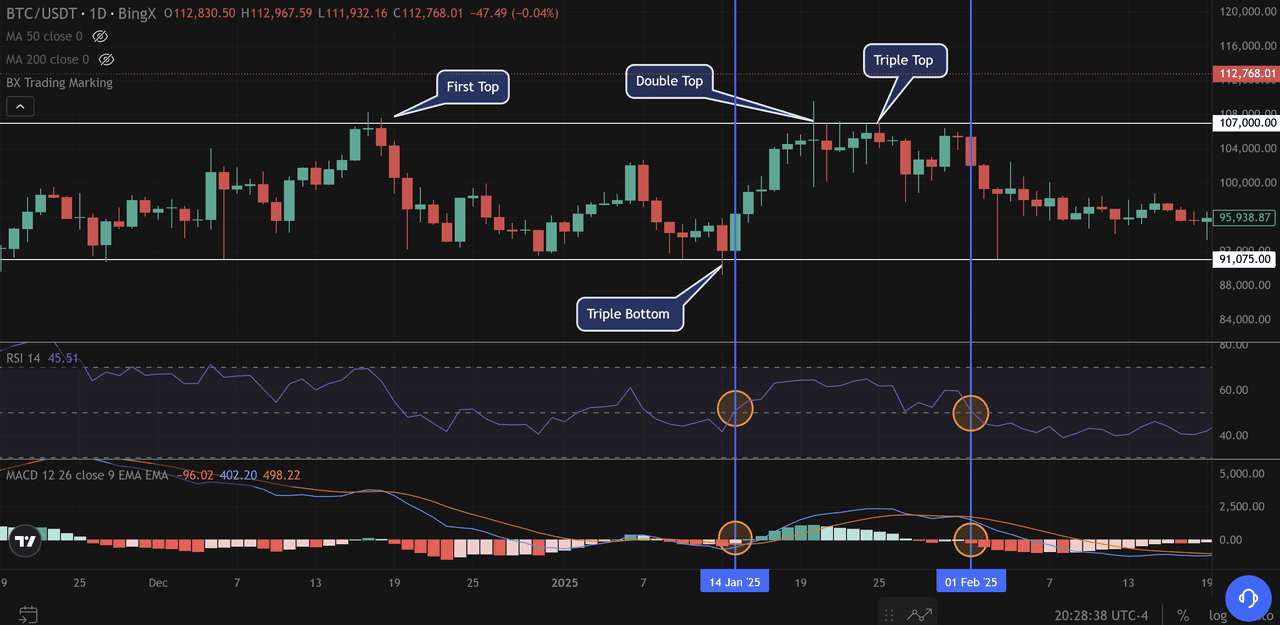
Source: BTC/USDT Trading Chart on BingX
On the BTC/USD daily chart above, Bitcoin shows both formations within a few months:
• Around late December 2024 and January 2025, BTC carved out a triple bottom near $91,075. Each attempt to break lower failed, and price rebounded strongly.
• Soon after, BTC ran into resistance near $107,000. It tested this level three times but couldn’t break higher, creating a triple top. The eventual drop confirmed bearish reversal.
These back-to-back patterns highlight the importance of context. Bottoms mark the end of selling pressure and hint at a rally. Tops show fading demand and prepare the ground for correction.
What Happens After a Triple Bottom
A triple bottom usually signals the end of a downtrend and the start of a bullish reversal. Once the market fails three times to push lower, sellers lose strength and buyers step in. The key confirmation comes when price breaks and closes above the neckline , the resistance drawn across the highs between the three lows.
How to confirm the triple bottom breakout
• Identify the highest swing point between the first and third lows
• Draw a horizontal neckline through this level
• Wait for a strong close above the neckline
Traders often look for extra confirmation, such as higher trading volume or wider bullish candles, during the breakout. These factors don’t guarantee success, but they increase the odds that the rally will follow through.
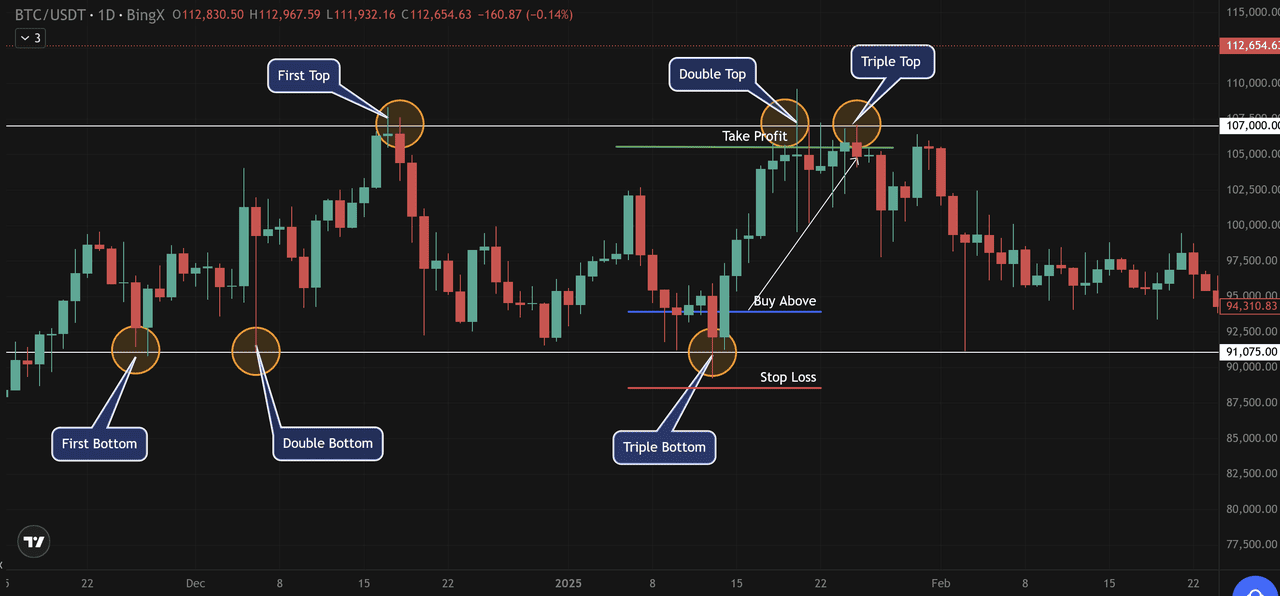
Source: BTC/USDT Trading Chart on BingX
Scenario 1: Buying Above a Triple Bottom
In the BTC/USDT daily chart, Bitcoin formed a clear triple bottom around the $91,075 support level. Each attempt to break lower failed, confirming that sellers were losing strength.
Traders looking for a long entry could wait for price to break above the neckline resistance near $107,000. The breakout serves as confirmation of the bullish reversal.
• Entry: Buy above the neckline once price confirms the breakout
• Stop-loss: Placed just below the lowest low of the triple bottom (around $91,075)
• Target: The height of the pattern projected upward. In this case, the measured move pointed toward the $107,000 zone, where traders could lock in profits
This setup shows how a triple bottom can help traders align risk and reward. By waiting for confirmation, entries are based on structure rather than guesswork.
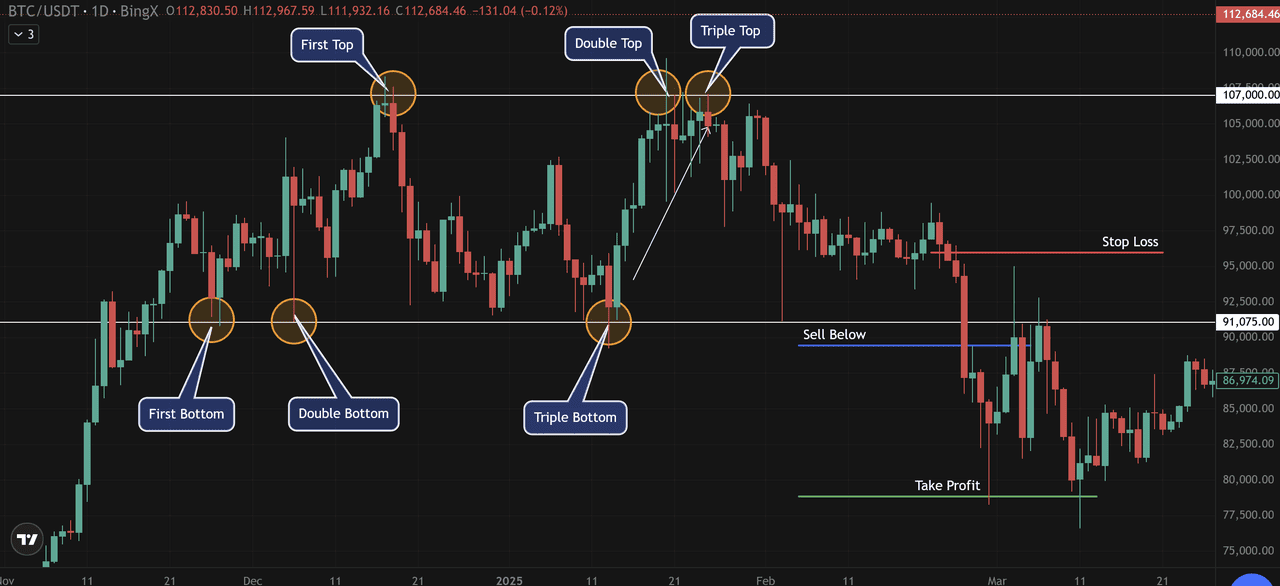
Source: BTC/USDT Trading Chart on BingX
Scenario 2: Selling After a Triple Top
On the BTC/USDT daily chart, Bitcoin formed a triple top around the $107,000 resistance. Each rally attempt stalled near this level, showing buyers were unable to break higher. Once price closed below the neckline near $91,075, the bearish reversal was confirmed.
• Entry: Sell below the neckline after confirmation of the breakdown
• Stop-loss: Placed just above the highest peak of the triple top, around $97,500
• Target: The measured move equals the height of the pattern, projected downward. In this example, the target pointed toward $80,000, where traders could take profit
This scenario shows how a triple top allows traders to anticipate a correction early. By setting clear entry, stop-loss, and target levels, the setup offers structured risk management instead of reacting after the sell-off has already started.
What Happens After a Triple Top Chart Pattern?
A triple top usually marks the end of a rally and the start of a bearish reversal. After three failed attempts to break higher, buyers lose momentum and sellers take control. The key level to watch is the neckline , drawn across the lowest point between the three highs.
How to confirm the breakdown
• Draw a horizontal line through the lowest swing point between the peaks
• Wait for a decisive close below this neckline
• Look for added confirmation from high trading volume or strong bearish candles
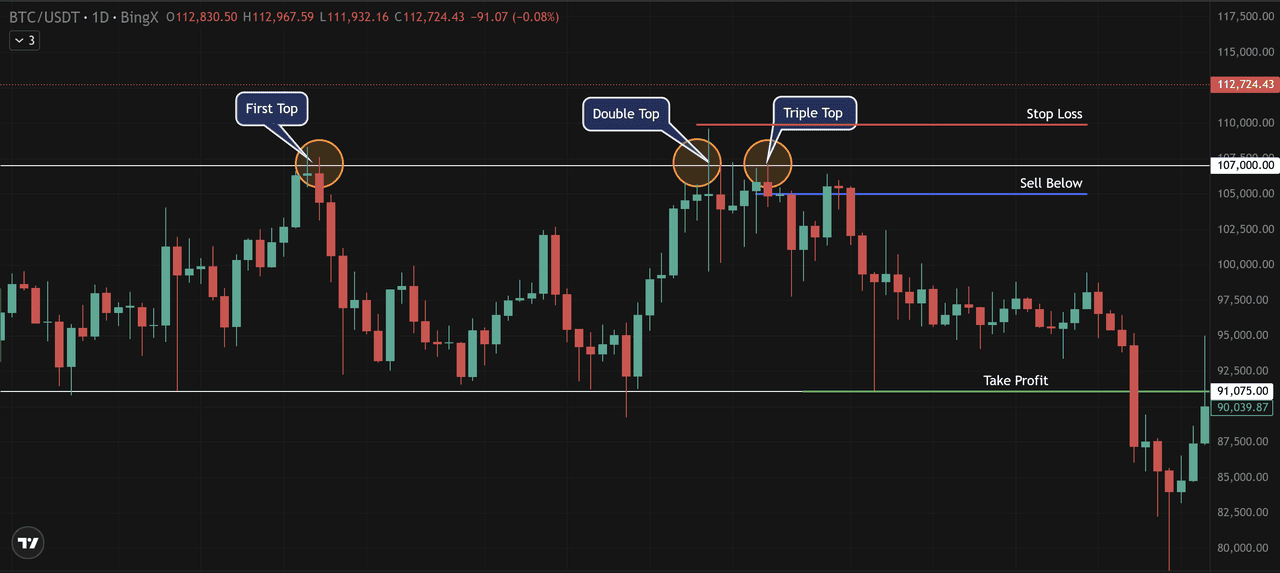
Source: BTC/USDT Trading Chart on BingX
Scenario: Selling After a Triple Top
On the BTC/USDT daily chart, Bitcoin faced resistance near $107,000 three times, creating a triple top formation. Each rally stalled, showing that buying pressure was fading. Once price closed below the neckline, the bearish reversal was confirmed.
Trade setup from the chart
• Sell entry: Below the neckline at $107,000 after confirmation
• Stop-loss: Placed just above the highest peak of the triple top, near $112,700
• Take profit: Measured by the height of the pattern projected downward, targeting the $91,075 zone
This trade setup shows how a triple top can provide structure to a bearish move. Traders who wait for confirmation reduce the risk of false signals and can align entries, stops, and targets with clear technical logic.
How to Combine Triple Tops and Bottoms with RSI and MACD
Chart patterns gain more reliability when paired with momentum indicators. Using the Relative Strength Index (RSI) and the Moving Average Convergence Divergence (MACD) helps traders filter false signals and build stronger trade setups.
Source: BTC/USDT Trading Chart on BingX
1. Using RSI with Triple Tops and Bottoms
The RSI measures momentum and overbought/oversold conditions. In the BTC/USDT chart, when the triple bottom formed near $91,075 in mid-January, RSI rebounded from the 40 level and pushed above 50 as price broke toward $107,000.
This momentum shift confirmed buying strength behind the breakout. Later, during the triple top at $107,000 in early February, RSI failed to climb above 55 and instead drifted lower, showing buyers were exhausted before the sell-off began.
2. Using MACD with Triple Tops and Bottoms
MACD tracks trend shifts through moving averages and histogram momentum. At the $91,075 triple bottom, MACD flashed a bullish crossover on 14 January, with histogram bars turning green as BTC rallied above the neckline.
In contrast, at the $107,000 triple top, MACD rolled over with a bearish crossover on 1 February, and histogram bars flipped red , aligning with the sharp decline that followed.
By combining RSI and MACD with price structure, traders can validate whether breakouts or breakdowns have real momentum. This layered confirmation improves confidence and reduces the risk of entering false moves.
What Are the Limitations of Triple Top and Bottom Patterns?
Triple tops and bottoms can be powerful reversal signals, but they are not foolproof. Traders need to be aware of the limitations that come with these setups.
One common issue is false signals. A breakout or breakdown that happens on weak trading volume is often unreliable. Without strong participation, price can quickly snap back into the previous range, trapping traders who entered too early.
Patience is also critical. Many traders jump in as soon as they see two or three highs or lows forming, only to find out the pattern is incomplete. Waiting for a confirmed close beyond the neckline greatly improves accuracy.
These formations also tend to work better on high-liquidity coins like Bitcoin and Ethereum. Smaller altcoins often lack the volume to follow through after a breakout, making them more prone to failed setups.
Lastly, stop-loss protection is essential. Even with confirmation, no pattern works 100% of the time. A well-placed stop below the lowest low (for triple bottoms) or above the highest high (for triple tops) helps limit risk if the market moves against the trade.
Conclusion
Triple bottoms and triple tops are classic reversal patterns that help traders anticipate turning points. A triple bottom signals a bullish reversal, while a triple top warns of a bearish shift.
The key is to always wait for confirmation, a decisive breakout or breakdown beyond the neckline , before acting. Entering too early often leads to false signals and unnecessary losses.
For higher accuracy, these setups work best when paired with other tools such as volume, RSI, or MACD. By combining price structure with momentum and trend confirmation, traders can increase confidence in their entries and manage risk more effectively.
Related Reading
FAQs on Triple Top and Bottom Chart Patterns
1. Are triple top and triple bottom patterns reliable in crypto trading?
They can be reliable when confirmed with volume and momentum, but false signals are common in low-liquidity coins. Always wait for confirmation before entering a trade.
2. Which timeframe works best for spotting triple tops and bottoms?
These patterns can appear on any timeframe, but daily and weekly charts usually provide stronger, more reliable signals than intraday charts.
3. How do triple tops and bottoms differ from head and shoulders patterns?
Triple tops and bottoms show three equal highs or lows. Head and shoulders patterns have a distinct middle peak (or trough) that stands taller or deeper than the sides.
4. Can I trade triple top and bottom patterns without indicators?
Yes, but combining them with tools like RSI, MACD, or volume analysis increases accuracy and helps filter out false signals.
5. What’s the best way to manage risk when trading these patterns?
Use stop-loss orders , below the lowest low for a triple bottom, or above the highest high for a triple top. This protects capital if the pattern fails.
